

Average Sale Price - Carbon
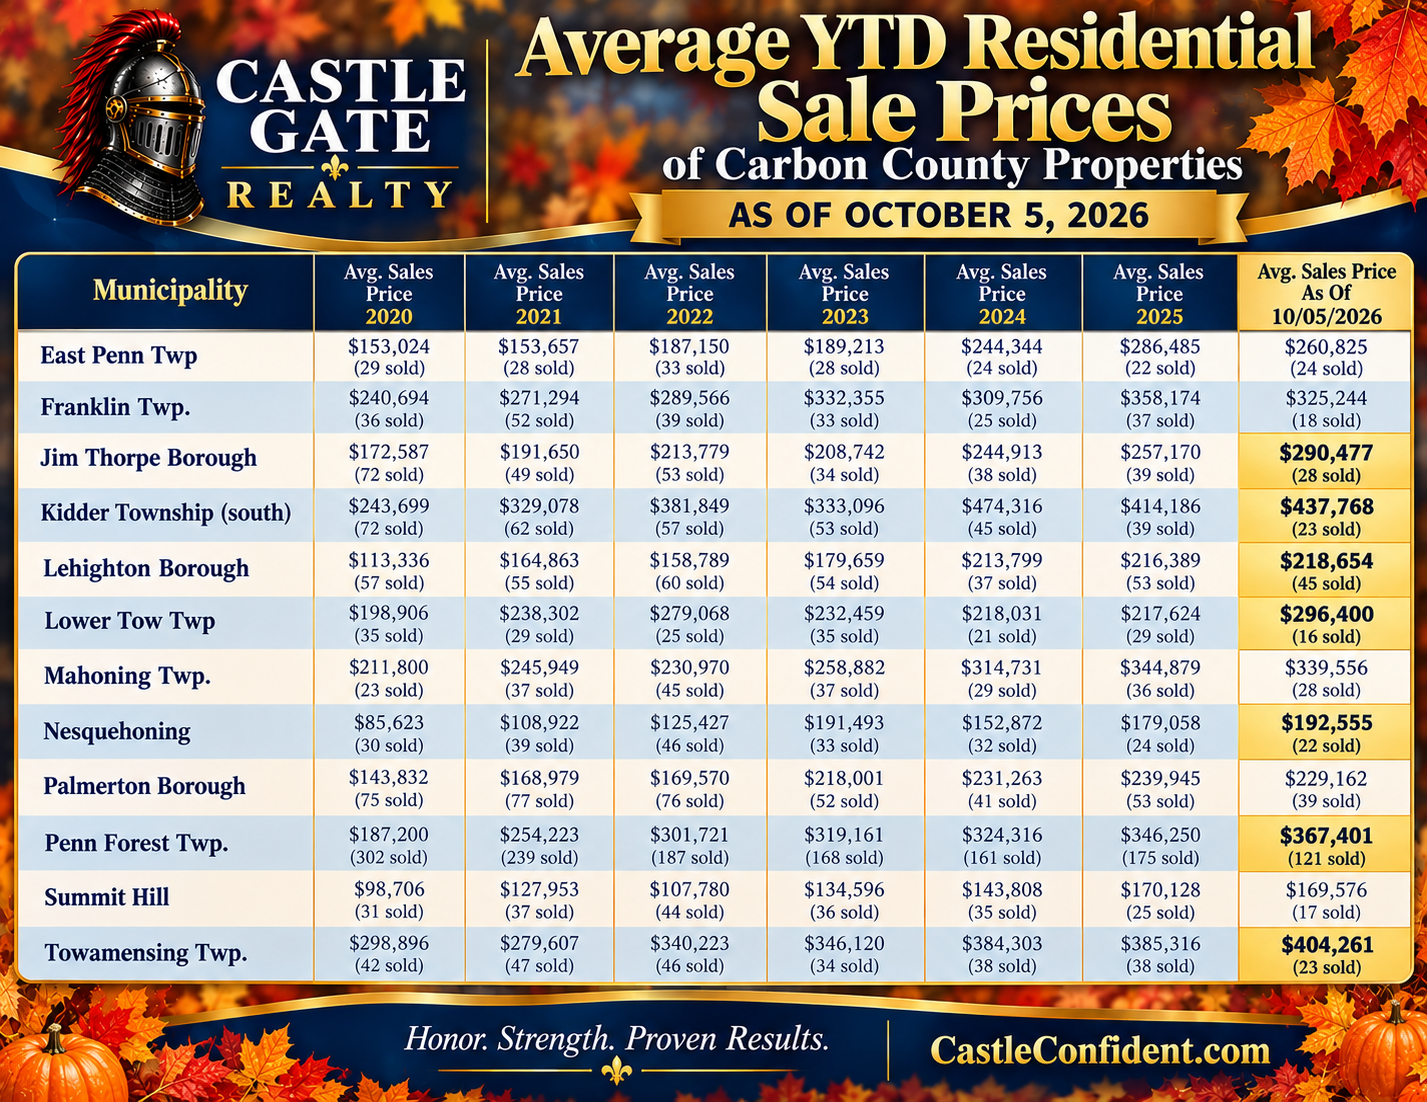
Carbon County PA Home Prices by Municipality: 2020–2026
How much are homes selling for in Carbon County, Pennsylvania? Have home values increased in Lehighton, Jim Thorpe, Palmerton, and surrounding communities? Which Carbon County towns have the highest average sale prices?
Castle Gate Realty has compiled residential real estate sales statistics for 12 Carbon County municipalities, comparing average home sale prices and the number of properties sold each year from 2020 through October 5, 2026.
This historical housing market report helps buyers, sellers, homeowners, and investors understand how local real estate markets have changed over time.
Carbon County Residential Sale Price Comparison: 2020–2026
The following chart includes the average residential sale price and number of homes sold in each municipality. The 2020–2025 figures represent full calendar years. The 2026 figures are year-to-date through October 5, 2026.
East Penn Township, PA
Year Average Sale Price Homes Sold 2020 $153,024 29 2021 $153,657 28 2022 $187,150 33 2023 $189,213 28 2024 $244,344 24 2025 $286,485 22 2026 YTD $260,825 24
| Year | Average Sale Price | Homes Sold |
|---|---|---|
| 2020 | $153,024 | 29 |
| 2021 | $153,657 | 28 |
| 2022 | $187,150 | 33 |
| 2023 | $189,213 | 28 |
| 2024 | $244,344 | 24 |
| 2025 | $286,485 | 22 |
| 2026 YTD | $260,825 | 24 |
East Penn Township's average residential sale price increased approximately 70% from 2020 to 2026 YTD.
Franklin Township, PA
Year Average Sale Price Homes Sold 2020 $240,694 36 2021 $271,294 52 2022 $289,566 39 2023 $332,355 33 2024 $309,756 25 2025 $358,174 37 2026 YTD $325,244 18
| Year | Average Sale Price | Homes Sold |
|---|---|---|
| 2020 | $240,694 | 36 |
| 2021 | $271,294 | 52 |
| 2022 | $289,566 | 39 |
| 2023 | $332,355 | 33 |
| 2024 | $309,756 | 25 |
| 2025 | $358,174 | 37 |
| 2026 YTD | $325,244 | 18 |
Franklin Township's 2026 year-to-date average residential sale price is $325,244, compared with $240,694 in 2020.
Jim Thorpe Borough, PA
Year Average Sale Price Homes Sold 2020 $172,587 72 2021 $191,650 49 2022 $213,779 53 2023 $208,742 34 2024 $244,913 38 2025 $257,170 39 2026 YTD $290,477 28
| Year | Average Sale Price | Homes Sold |
|---|---|---|
| 2020 | $172,587 | 72 |
| 2021 | $191,650 | 49 |
| 2022 | $213,779 | 53 |
| 2023 | $208,742 | 34 |
| 2024 | $244,913 | 38 |
| 2025 | $257,170 | 39 |
| 2026 YTD | $290,477 | 28 |
Jim Thorpe Borough's average residential sale price increased approximately 68% between 2020 and 2026 YTD.
Kidder Township (South), PA
Year Average Sale Price Homes Sold 2020 $243,699 72 2021 $329,078 62 2022 $381,849 57 2023 $333,096 53 2024 $474,316 45 2025 $414,186 39 2026 YTD $437,768 23
| Year | Average Sale Price | Homes Sold |
|---|---|---|
| 2020 | $243,699 | 72 |
| 2021 | $329,078 | 62 |
| 2022 | $381,849 | 57 |
| 2023 | $333,096 | 53 |
| 2024 | $474,316 | 45 |
| 2025 | $414,186 | 39 |
| 2026 YTD | $437,768 | 23 |
Kidder Township (South), which includes part of the Lake Harmony area, has the highest 2026 average residential sale price among the municipalities included in this report.
Lehighton Borough, PA
Year Average Sale Price Homes Sold 2020 $113,336 57 2021 $164,863 55 2022 $158,789 60 2023 $179,659 54 2024 $213,799 37 2025 $216,389 53 2026 YTD $218,654 45
| Year | Average Sale Price | Homes Sold |
|---|---|---|
| 2020 | $113,336 | 57 |
| 2021 | $164,863 | 55 |
| 2022 | $158,789 | 60 |
| 2023 | $179,659 | 54 |
| 2024 | $213,799 | 37 |
| 2025 | $216,389 | 53 |
| 2026 YTD | $218,654 | 45 |
Lehighton Borough's average residential sale price increased approximately 93% from 2020 to 2026 YTD.
Lower Towamensing Township, PA
Year Average Sale Price Homes Sold 2020 $198,906 35 2021 $238,302 29 2022 $279,068 25 2023 $232,459 35 2024 $218,031 21 2025 $217,624 29 2026 YTD $296,400 16
| Year | Average Sale Price | Homes Sold |
|---|---|---|
| 2020 | $198,906 | 35 |
| 2021 | $238,302 | 29 |
| 2022 | $279,068 | 25 |
| 2023 | $232,459 | 35 |
| 2024 | $218,031 | 21 |
| 2025 | $217,624 | 29 |
| 2026 YTD | $296,400 | 16 |
Lower Towamensing Township's 2026 year-to-date average sale price is approximately 49% higher than its 2020 average.
Mahoning Township, PA
Year Average Sale Price Homes Sold 2020 $211,800 23 2021 $245,949 37 2022 $230,970 45 2023 $258,882 37 2024 $314,731 29 2025 $344,879 36 2026 YTD $339,556 28
| Year | Average Sale Price | Homes Sold |
|---|---|---|
| 2020 | $211,800 | 23 |
| 2021 | $245,949 | 37 |
| 2022 | $230,970 | 45 |
| 2023 | $258,882 | 37 |
| 2024 | $314,731 | 29 |
| 2025 | $344,879 | 36 |
| 2026 YTD | $339,556 | 28 |
Mahoning Township's average residential sale price increased approximately 60% between 2020 and 2026 YTD.
Nesquehoning Borough, PA
Year Average Sale Price Homes Sold 2020 $85,623 30 2021 $108,922 39 2022 $125,427 46 2023 $191,493 33 2024 $152,872 32 2025 $179,058 24 2026 YTD $192,555 22
| Year | Average Sale Price | Homes Sold |
|---|---|---|
| 2020 | $85,623 | 30 |
| 2021 | $108,922 | 39 |
| 2022 | $125,427 | 46 |
| 2023 | $191,493 | 33 |
| 2024 | $152,872 | 32 |
| 2025 | $179,058 | 24 |
| 2026 YTD | $192,555 | 22 |
Nesquehoning's average residential sale price increased approximately 125% from 2020 to 2026 YTD, the largest percentage increase among the municipalities in this comparison.
Palmerton Borough, PA
Year Average Sale Price Homes Sold 2020 $143,832 75 2021 $168,979 77 2022 $169,570 76 2023 $218,001 52 2024 $231,263 41 2025 $239,945 53 2026 YTD $229,162 39
| Year | Average Sale Price | Homes Sold |
|---|---|---|
| 2020 | $143,832 | 75 |
| 2021 | $168,979 | 77 |
| 2022 | $169,570 | 76 |
| 2023 | $218,001 | 52 |
| 2024 | $231,263 | 41 |
| 2025 | $239,945 | 53 |
| 2026 YTD | $229,162 | 39 |
Palmerton Borough's average residential sale price increased approximately 59% between 2020 and 2026 YTD.
Penn Forest Township, PA
Year Average Sale Price Homes Sold 2020 $187,200 302 2021 $254,223 239 2022 $301,721 187 2023 $319,161 168 2024 $324,316 161 2025 $346,250 175 2026 YTD $367,401 121
| Year | Average Sale Price | Homes Sold |
|---|---|---|
| 2020 | $187,200 | 302 |
| 2021 | $254,223 | 239 |
| 2022 | $301,721 | 187 |
| 2023 | $319,161 | 168 |
| 2024 | $324,316 | 161 |
| 2025 | $346,250 | 175 |
| 2026 YTD | $367,401 | 121 |
Penn Forest Township, which includes portions of the Albrightsville area, has experienced substantial changes in average residential sale prices. The 2026 YTD average is approximately 96% higher than in 2020.
Penn Forest Township also has the largest number of 2026 residential sales among the 12 municipalities in this report, with 121 homes sold through October 5.
Summit Hill Borough, PA
Year Average Sale Price Homes Sold 2020 $98,706 31 2021 $127,953 37 2022 $107,780 44 2023 $134,596 36 2024 $143,808 35 2025 $170,128 25 2026 YTD $169,576 17
| Year | Average Sale Price | Homes Sold |
|---|---|---|
| 2020 | $98,706 | 31 |
| 2021 | $127,953 | 37 |
| 2022 | $107,780 | 44 |
| 2023 | $134,596 | 36 |
| 2024 | $143,808 | 35 |
| 2025 | $170,128 | 25 |
| 2026 YTD | $169,576 | 17 |
Summit Hill has the lowest 2026 average residential sale price among the municipalities included in this report, at $169,576.
Towamensing Township, PA
Year Average Sale Price Homes Sold 2020 $298,896 42 2021 $279,607 47 2022 $340,223 46 2023 $346,120 34 2024 $384,303 38 2025 $385,316 38 2026 YTD $404,261 23
| Year | Average Sale Price | Homes Sold |
|---|---|---|
| 2020 | $298,896 | 42 |
| 2021 | $279,607 | 47 |
| 2022 | $340,223 | 46 |
| 2023 | $346,120 | 34 |
| 2024 | $384,303 | 38 |
| 2025 | $385,316 | 38 |
| 2026 YTD | $404,261 | 23 |
Towamensing Township's 2026 average residential sale price is $404,261, making it the second-highest average among the municipalities included in this comparison.
What Do These Home Sale Prices Mean for Carbon County Buyers and Sellers?
While these historical averages demonstrate how Carbon County's residential real estate market has changed, they do not establish the value of any individual property.
Average sale prices are influenced by the number, size, location, condition, and type of homes sold during each reporting period. A year with more luxury homes or lakefront sales, for example, may produce a higher average without indicating that every home's value increased.
For homeowners considering selling, accurate pricing requires a detailed comparative market analysis that examines similar properties and makes appropriate adjustments for differences in square footage, bedrooms, bathrooms, acreage, condition, location, and amenities.
At Castle Gate Realty, we don't just tell sellers what their home is worth. We show them the comparable properties, explain the adjustments, and demonstrate how we arrived at our recommended market value.
For buyers, these statistics provide a starting point for comparing communities, but a property's asking price should always be evaluated against relevant comparable sales.
Frequently Asked Questions About Carbon County PA Home Prices
What is the average home sale price in Carbon County, PA, in 2026?
The countywide year-to-date average residential sale price is $285,847 as of October 5, 2026.
How much have home prices increased in Lehighton, PA, since 2020?
Lehighton Borough's average residential sale price increased from $113,336 in 2020 to $218,654 in 2026 YTD, an increase of approximately 93%.
What is the average home sale price in Jim Thorpe, PA?
The 2026 year-to-date average residential sale price in Jim Thorpe Borough is $290,477, based on 28 closed sales.
How much are homes selling for in Palmerton, PA?
Palmerton Borough's 2026 year-to-date average residential sale price is $229,162, based on 39 closed sales.
What are home prices in Penn Forest Township and Albrightsville, PA?
Penn Forest Township's average residential sale price is $367,401 in 2026 YTD. Because Albrightsville includes properties in more than one municipality, buyers and sellers should use property-specific comparable sales rather than relying on one township average.
What is the average sale price of homes in Lake Harmony, PA?
Kidder Township (South) has a 2026 year-to-date average residential sale price of $437,768. Lake Harmony property values vary significantly based on lake access, waterfront location, property condition, and other characteristics.
Which Carbon County municipality has the highest average home sale price?
Among the 12 areas included in this report, Kidder Township (South) has the highest 2026 year-to-date average sale price at $437,768, followed by Towamensing Township at $404,261.
Which Carbon County towns have the lowest average home sale prices?
Summit Hill ($169,576), Nesquehoning ($192,555), and Lehighton Borough ($218,654) have the lowest 2026 year-to-date average sale prices among the municipalities in this report.
How do I find out what my home is worth in Carbon County, PA?
A detailed comparative market analysis from a knowledgeable local real estate professional is one of the best ways to estimate a home's current market value. Castle Gate Realty evaluates recent comparable sales, current competition, pending transactions, and property-specific characteristics to help homeowners understand their property's market position.
Who can help me buy or sell a home in Carbon County, Pennsylvania?
Castle Gate Realty serves homebuyers and sellers throughout Carbon County, including Lehighton, Jim Thorpe, Palmerton, Nesquehoning, Summit Hill, Weatherly, Albrightsville, Lake Harmony, and surrounding communities. Our brokerage also serves the Lehigh Valley and neighboring Pennsylvania counties.
Castle Gate Realty: Carbon County Real Estate Market Experts
Real estate is local. The housing market in Lehighton Borough is different from the market in Jim Thorpe, Palmerton, Penn Forest Township, or Lake Harmony.
Understanding those differences is essential when determining an asking price, evaluating an offer, or deciding where to purchase a home.
Castle Gate Realty is a locally focused, full-time real estate brokerage committed to knowledgeable market analysis, professional representation, and strong negotiation skills.
Whether you're buying your first home, selling a longtime residence, relocating, or investing in Carbon County real estate, our agents can help you make informed decisions based on actual market data.
Thinking about buying or selling in Carbon County, PA?
Visit CastleConfident.com to explore available homes, learn more about the local real estate market, or connect with a Castle Gate Realty agent.
Castle Gate Realty
Honor. Strength. Proven Results.
Market data as of October 5, 2026. Annual statistics for 2020–2025 represent full calendar years. The 2026 statistics are year-to-date. Percentage changes compare average sale prices rather than measuring appreciation of individual properties. Market conditions and averages are subject to change.
These figures also need to be interpreted alongside the number and type of homes sold. A municipality with relatively few sales can experience a significant change in its average price simply because the mix of properties sold changed. Average sale price should therefore be considered together with inventory, recent comparable sales, property type, condition, location and price range when evaluating an individual home's market value.
Local Carbon
What Is My Home Worth in Carbon County, Pennsylvania?
If you're considering selling a home in Lehighton, Jim Thorpe, Palmerton, Penn Forest Township, Kidder Township, Mahoning Township, Franklin Township, East Penn Township, Lower Towamensing Township, Towamensing Township, Nesquehoning, Summit Hill or another Carbon County community, local comparable sales matter.
An online home-value estimate can be a starting point, but it should not replace a professional valuation based on the properties that actually compete with your home.
Castle Gate Realty analyzes recently sold homes, active competition, pending sales, location, property characteristics and current Carbon County buyer demand when helping homeowners determine an appropriate market value and listing strategy.
About Castle Gate Realty's Carbon County Market Reports
Castle Gate Realty tracks local housing data to provide homeowners, buyers and sellers with detailed information about Carbon County home prices, residential sales, housing inventory and real estate trends by municipality.
Our goal is to provide useful local data that goes deeper than national housing headlines and broad countywide averages.
Castle Gate Realty publishes monthly local market reports from its office in Lehighton, Pennsylvania, to help buyers and sellers make informed real estate decisions throughout Northeastern Pennsylvania.
Castle Gate Realty
238 N 1st Street
Lehighton, PA 18235
Phone: 610-379-FLAG (3524)
Email: CastleConfident@gmail.com
Website: CastleConfident.com
Serving Carbon • Monroe • Schuylkill • Lehigh • Northampton Counties
Honor. Strength. Proven Results.